Exporting Charts and Tables
Most of engineers have their own spreadsheets for calculations and presentation of the analyses results. You may prefer keeping your reports in the same format. To do this, you need to export the analyses results into other formats such as Microsoft Excel. To export the results, select File>Export menu or click on
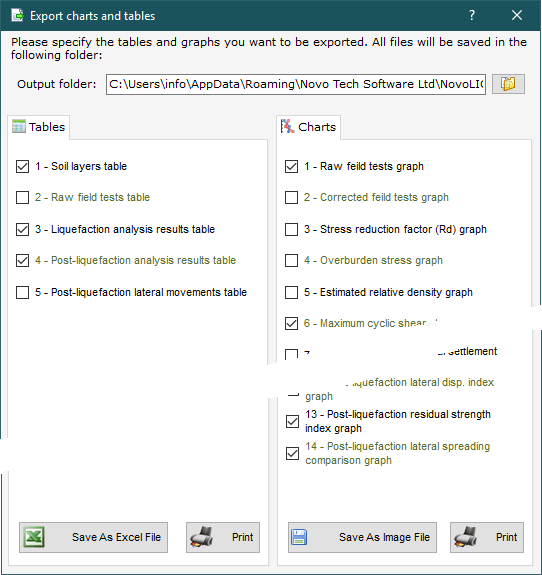
Please select the items you want to export, then specify the output folder. You can change this folder by clicking on the folder button. Exporting TablesTables can be saved as Microsoft Excel or may be directly sent to the printer. Exporting Graphs (Charts)All charts (graphs) may be saved as image files (BMP, PNG, JPG formats) or printed directly. |